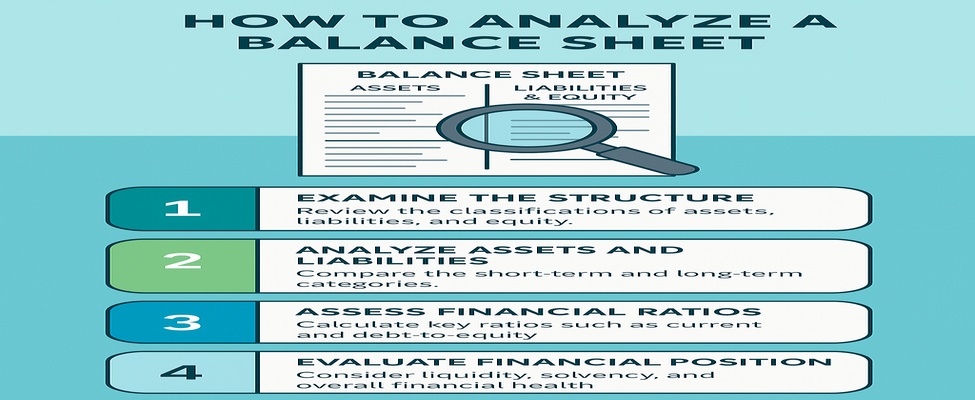
How to Analyze a Balance Sheet: A Guide for Finance Professionals
Whether you're a seasoned financial analyst, an aspiring accountant, or a recruiter in the finance space, understanding how to analyze a balance sheet is an essential skill. A balance sheet gives a snapshot of a company’s financial health at a specific point in time. It’s more than just numbers — it’s a story of how a business is funding its operations, managing its resources, and positioning itself for the future.
In this blog, we’ll break down the key components of a balance sheet and show you how to interpret them like a pro.
What Is a Balance Sheet?
A balance sheet is one of the three core financial statements, alongside the income statement and the cash flow statement. It presents a company’s financial position by listing its assets, liabilities, and shareholders' equity.
The fundamental equation it follows is:
Assets = Liabilities + Shareholders’ Equity
This equation ensures that the balance sheet always “balances” — every dollar invested in a company is either used to purchase assets or incurred as a liability.
The Three Main Sections of a Balance Sheet
Let’s break down the components.
1. Assets
Assets are what the company owns. They are usually listed in order of liquidity, from the most liquid (like cash) to the least liquid (like property or intangible assets).
Types of assets:
• Current Assets: Expected to be converted into cash within a year.
o Examples: Cash, accounts receivable, inventory, prepaid expenses.
• Non-current Assets (Fixed Assets): Long-term investments or assets used in operations.
o Examples: Property, plant and equipment (PPE), goodwill, intangible assets.
2. Liabilities
Liabilities are what the company owes — its financial obligations.
Types of liabilities:
• Current Liabilities: Obligations due within a year.
o Examples: Accounts payable, accrued expenses, short-term debt.
• Non-current Liabilities: Long-term obligations.
o Examples: Long-term loans, bonds payable, pension liabilities.
3. Shareholders’ Equity
This represents the owners’ claims after liabilities are settled. It includes:
• Common stock
• Retained earnings
• Additional paid-in capital
• Treasury stock (if applicable)
In simple terms, it’s what remains for shareholders after debts are paid.
Step-by-Step: How to Analyze a Balance Sheet
Step 1: Understand the Structure
Before diving into ratios or trends, familiarize yourself with the structure of the balance sheet. What kind of business is it? Are there specific line items relevant to their industry (like inventory for a retailer or goodwill for a company that’s made acquisitions)?
Step 2: Assess Liquidity
Liquidity tells you how easily a company can meet its short-term obligations.
Key metrics:
• Current Ratio = Current Assets / Current Liabilities
o A ratio above 1 generally indicates healthy liquidity.
• Quick Ratio = (Current Assets – Inventory) / Current Liabilities
o More conservative, since it excludes inventory.
A higher ratio signals more liquidity, but if it's too high, the company might be hoarding cash inefficiently.
Step 3: Evaluate Leverage
Leverage indicates how much of the company’s operations are funded by debt.
Key metrics:
• Debt-to-Equity Ratio = Total Liabilities / Shareholders’ Equity
• Equity Ratio = Shareholders’ Equity / Total Assets
High leverage can amplify returns but also increase risk. Compare these ratios to industry benchmarks.
Step 4: Examine Asset Management
Are the company’s assets being used effectively?
Look at:
• Changes in asset levels year over year.
• The composition of assets — is it cash-heavy, or capital-intensive?
• Return on Assets (ROA) = Net Income / Total Assets
o While ROA uses income statement data, it’s a valuable indicator in balance sheet analysis.
Step 5: Analyze Working Capital
Working Capital = Current Assets – Current Liabilities
Positive working capital indicates the company can fund daily operations. Negative working capital isn’t always bad — some companies (like grocery chains) can operate effectively with it — but it’s important to understand why.
Step 6: Identify Trends and Red Flags
Use comparative balance sheets (multiple periods) to spot:
• Sudden increases in receivables (could mean collection issues)
• Declining cash reserves
• Growing liabilities with stagnant or declining equity
• Rapid growth in intangible assets (could indicate aggressive acquisitions or capitalization practices) Consistency and transparency are good signs; major unexplained shifts are red flags.
Common Mistakes to Avoid
• Focusing on totals instead of ratios: Always consider proportion, not just magnitude.
• Ignoring footnotes: The footnotes often contain key details on asset valuation, contingencies, or changes in accounting policies.
• Overlooking industry context: A good debt-to-equity ratio in one industry might be terrible in another. Always compare to sector norms.
• Isolating the balance sheet: Combine insights with the income statement and cash flow statement for a complete picture.
Use Cases: Why Balance Sheet Analysis Matters
• Investors use it to evaluate financial stability and risk.
• Lenders analyze balance sheets to assess creditworthiness.
• Job seekers in accounting or finance should understand it to stand out in interviews.
• Hiring managers can test candidates' analytical ability with balance sheet questions.
If you’re serious about financial analysis, consider tools like:
• Microsoft Excel – Great for building models and ratio analysis.
• Power BI / Tableau – For visualizing trends.
• QuickBooks / Xero – For small business balance sheets.
• EDGAR / SEC filings – For publicly listed companies.
